Live Server Monitor
Servus vigilans
A live wp-admin dashboard for your server and WordPress stack — CPU, RAM, disk, PHP, MySQL, SSL & domain expiry, pending updates, and a scored A–D health diagnosis. The whole stack on one screen, updating every couple of seconds.
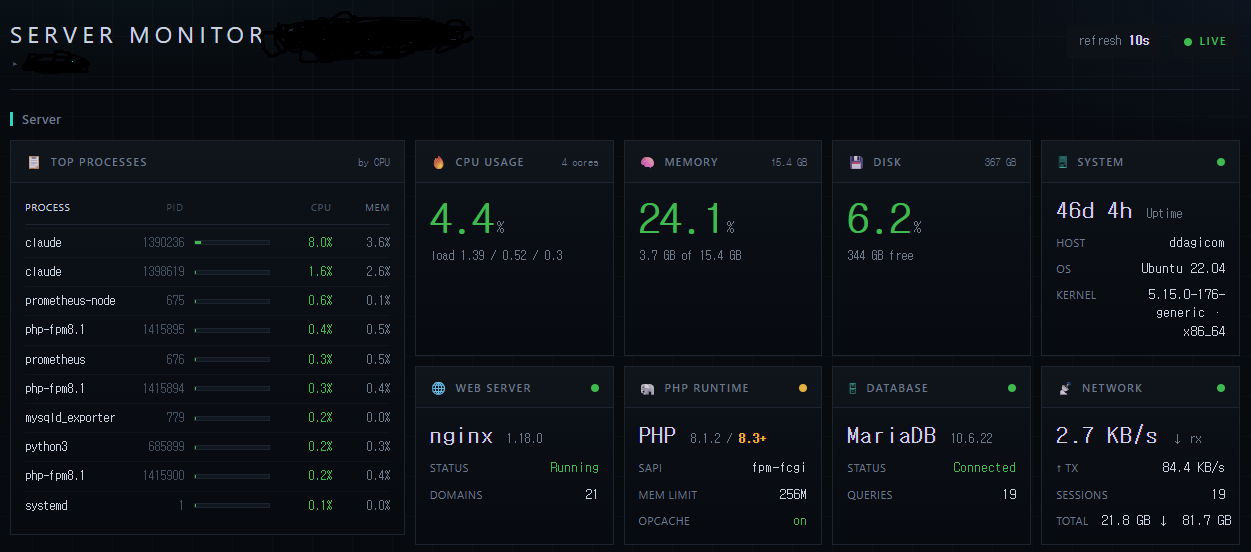
The whole server, live.
CPU usage and load average, memory, disk, network throughput, connection count and the top processes by CPU — read straight from /proc, with no agent or daemon to install. Cards update every couple of seconds, Apple-Home style.
- Animated CPU ring with load average and core count
- Memory used / total and disk usage for the WordPress filesystem
- Network throughput, open connections and top processes
- System uptime, hostname, kernel and OS at a glance
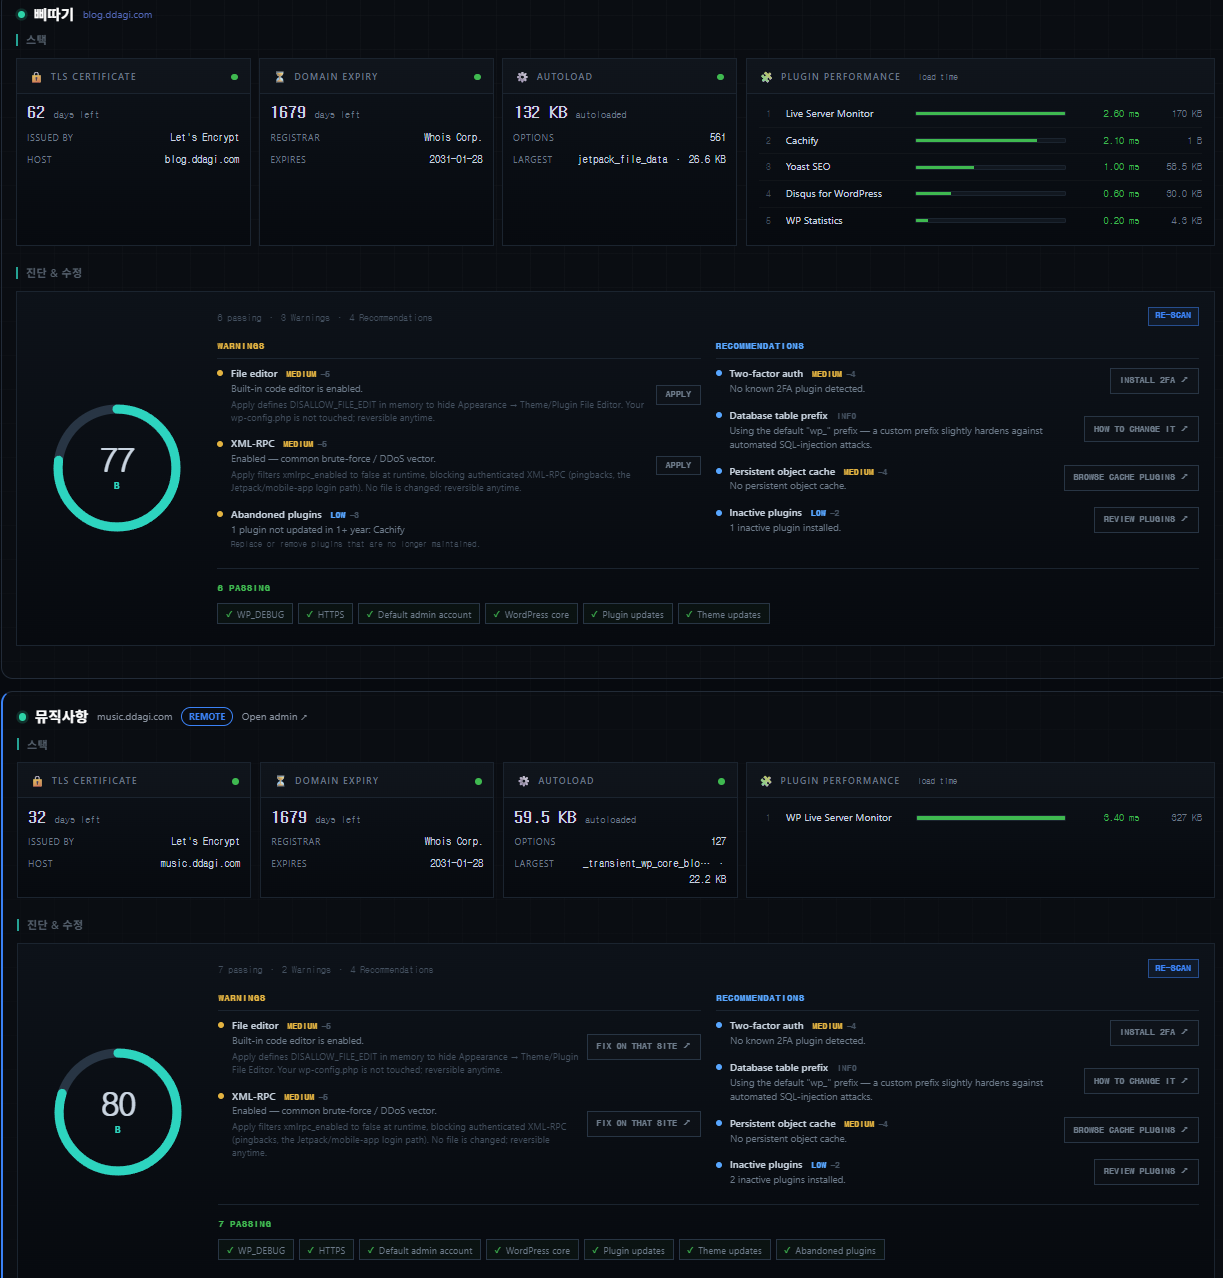
Stack & WordPress health.
Most monitors only look at WordPress. This one watches the whole stack — TLS, the registrar, DNS, PHP, the database and the plugins that weigh down every request.
- TLS certificate days-until-expiry, with issuer
- Domain registration expiry via RDAP/WHOIS, with registrar
- A “does DNS actually point here?” check
- Autoload-options analysis — find the data bloating every request
- Per-plugin performance — which active plugins are slowest to boot
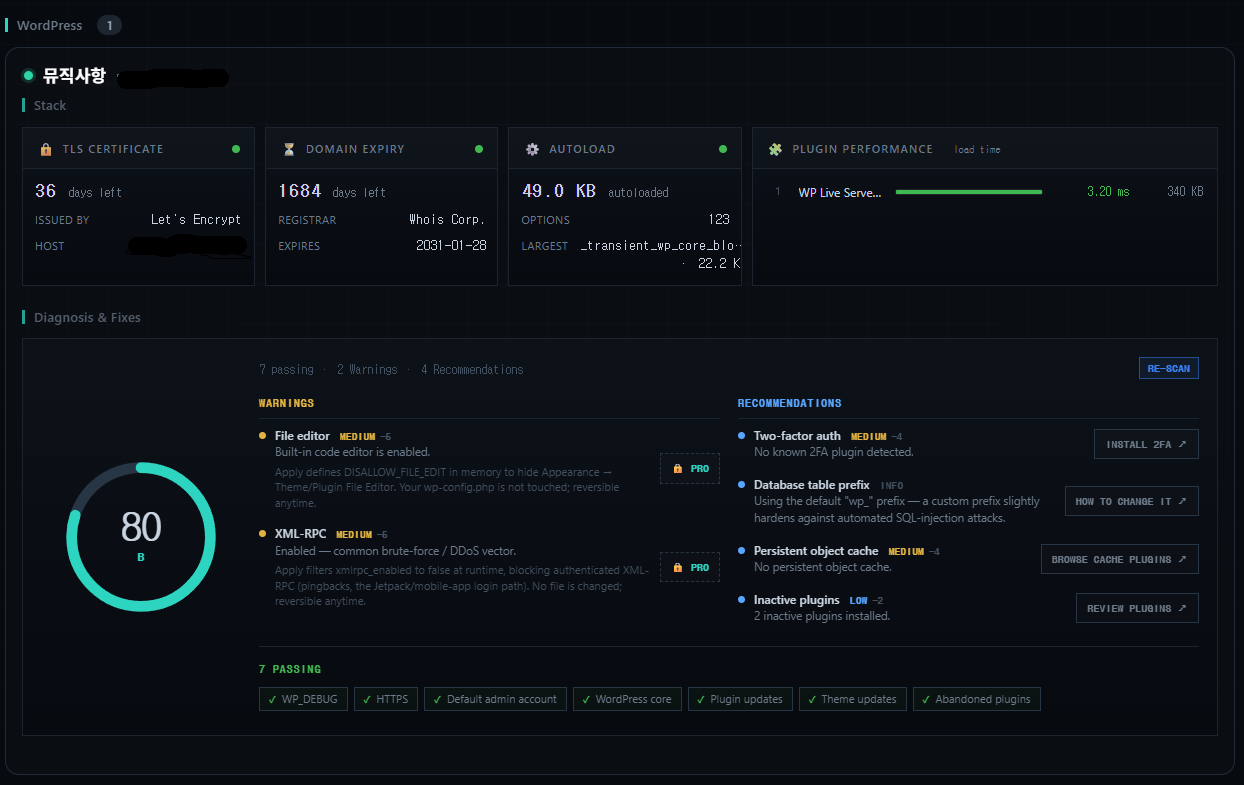
A scored diagnosis you can act on.
A 0–100 security, performance and maintenance check-up with an A–D grade and prioritised findings — refreshed on demand. Every finding carries a real next step.
- One-click fixes the plugin applies safely — disable XML-RPC, disable the file editor — and can fully reverse
- A deep link to the right admin screen where only you can act
- A plain explanation when only a server change will do — no dead ends
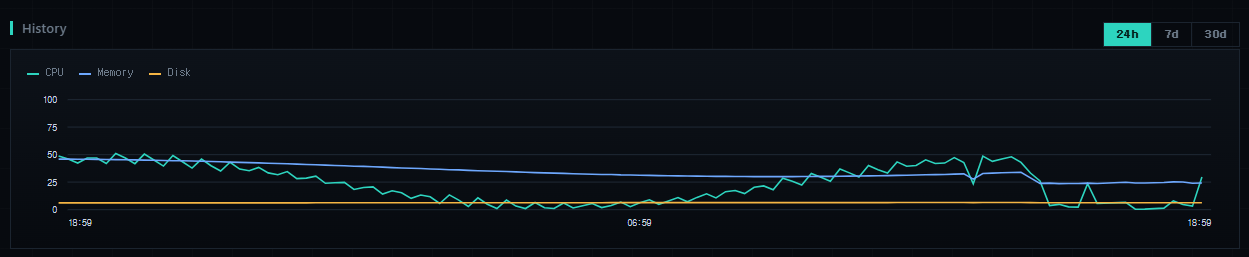
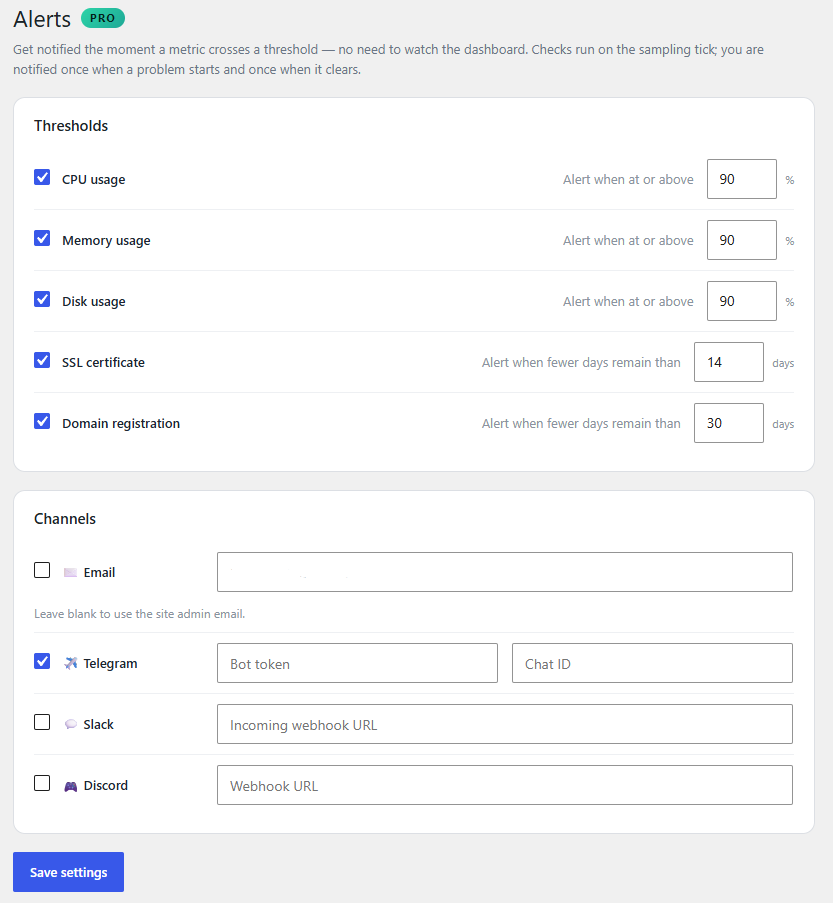
History & smart alerts.
Stop ahead of problems instead of watching a dashboard. A lightweight time-series sampler runs on wp-cron — zero setup, no crontab, no SSH — so trends accumulate on their own.
- 24h / 7d / 30d graphs of CPU, memory, disk and more
- Edge-triggered alerts for CPU, RAM, disk, SSL and domain-expiry thresholds
- Delivered to email, Telegram, Slack or Discord — once per transition, never per tick
- Power users can drive sampling from system cron for tighter timing
One hub for every site.
Watch every site you manage from one dashboard — up to 20 of them. Each child exposes its metrics behind a per-site connection key in a custom header, so there’s no server config to change: activate, paste the key, done.
- Central multi-site monitoring from a single hub
- Centralised alerts across all your sites and domains
- Connection keys are CSPRNG-generated and encrypted at rest
- Monthly PDF client reports (coming soon)
Twelve signals, one screen.
Every probe reports whether it’s available, so the dashboard stays honest on restricted hosts — it shows “N/A” instead of breaking.
- CPU / LoadUsage, load average, cores
- MemoryUsed / total
- DiskWordPress filesystem usage
- NetworkThroughput & connections
- PHP / SAPIVersion, limits, OPcache
- MySQLEngine, version, queries
- SSL daysCert expiry & issuer
- DomainRDAP expiry & registrar
- DNSDoes it point here?
- AutoloadPer-request option bloat
- Plugin perfSlowest plugins to boot
- Health score0–100, A–D grade
Free, then Pro when you outgrow it.
The free build is the complete monitoring dashboard — genuinely useful on day one, for a single site, forever. Pro and Agency add automation, not unlocks of crippled features.
The full live dashboard & diagnosis, single site.
- Server, stack, SSL & domain monitor
- Plugin performance profiler
- Health diagnosis — score & findings list
- Degrades gracefully on restricted hosts
- No telemetry
Everything in Free, plus automation.
- Everything in Free
- One-click fixes (reversible)
- Plugin performance trends
- History graphs — 24h / 7d / 30d
- Smart alerts — email · Telegram · Slack · Discord
Everything in Pro, across every client.
- Everything in Pro
- Multi-site central hub
- Centralised alerts across all sites
- Connection-key auth — no server config
- Monthly PDF reports (coming soon)
Before you install.
Do I need shell access?
No. Server cards (CPU, RAM, uptime) read from /proc and shine on a VPS, but where that’s blocked the plugin degrades gracefully — those cards show “N/A” and everything else (PHP, database, SSL, domain, DNS, WordPress) still works.
Does it phone home?
Your server and WordPress metrics never leave your site — they’re read locally and shown only to logged-in admins. The free build has no telemetry. A few functional, cached lookups happen (domain RDAP, api.wordpress.org for plugin dates, your own site’s TLS cert); Freemius handles licensing and updates for the paid tiers.
Will it slow my site down?
No. Network probes (TLS, DNS, RDAP) are cached for hours, history sampling runs on wp-cron, and the plugin-performance profiler is a tiny must-use drop-in with near-zero overhead. The dashboard polls in your admin, not on your visitors’ requests.
Do I need to set up a cron job?
No. History and alerts sample on wp-cron by default, which needs zero setup. Power users can optionally drive sampling from a real system cron for tighter timing.
Can I monitor more than one site?
Yes — that’s the Agency hub. Each site exposes its metrics behind a per-site connection key sent in a custom header, so no server configuration is needed; the hub reads its siblings and shows them together.
Put your server on one screen.
Install the free build, open the dashboard, and watch your whole stack breathe — then upgrade when you want history, alerts and one-click fixes.